Measuring LLM Serving Performance Under Load
Before reading: For a general introduction to the serving engine, start with the vLLM overview. Its optimization guide explains continuous batching, chunked prefill, and how scheduling choices can change latency and throughput.
An offline benchmark gives an inference engine a fixed batch and waits for it to finish. A real server receives requests over time. Some requests arrive separately, while others arrive together in bursts. As demand increases, the tokens per seconds (also known as throughput) might be very good but individual users wait too long for their answers. Therefore, a high total token rate does not necessarily mean that the server is giving users acceptable performance.
This study uses three measurements:
- Time to first token, TTFT: how long a user waits before the response begins.
- Time per output token, TPOT: the average time between one output token and the next after the response begins.
- Goodput: how many requests per second satisfy both latency requirements.
The question was: how do TTFT, TPOT, and goodput change under steady and bursty traffic, and how do common vLLM scheduling settings affect them?
Why this matters
Raw tokens per second does not show whether individual requests meet a latency goal. A queue can make responses unusably late while total throughput still rises. A service level objective, or SLO, defines the latency requirements that requests should meet. Capacity planning needs both an SLO and a traffic pattern that represents how requests actually arrive.
At the highest tested load, output throughput reached 355 tokens per second, but only 33.3% of requests met both latency limits. The GPU produced many tokens overall while most users would still experience unacceptable latency.
What we did
I served Qwen2.5-1.5B in FP16 through a real vLLM OpenAI-compatible server on one RTX 3060 12 GB GPU. An asynchronous client sent 4,608 requests across 96 matched runs. Prompts ranged from 128 to 4,096 tokens, outputs ranged from 32 to 256 tokens, and offered load ranged from 0.5 to 6 requests per second.
vLLM uses continuous batching, which lets it group requests that are ready for GPU work instead of waiting for one fixed batch to finish. It can also split a long prompt’s prefill into smaller chunks so decode work from active requests can run between those chunks. These mechanisms improve GPU use, but requests can still form a queue when work arrives faster than the GPU can process it.
I tested two arrival patterns:
- Poisson traffic: requests arrived individually with varying gaps.
- Fixed bursts: eight requests arrived simultaneously, followed by enough quiet time to preserve the same average rate.
With Poisson traffic, the gaps often gave the server time to process one prompt before many more arrived. As the rate increased, more requests overlapped and the queue grew. A fixed burst created that overlap immediately because eight prompts needed processing at the same time. Continuous batching helped process the active requests together, but it did not remove the initial waiting time.
Prefix caching was disabled in this experiment, so reused prompt prefixes did not explain the difference between the two traffic patterns. In a production workload where many requests share the same system prompt, prefix caching could reduce prefill work and change first-token latency. That would be a separate experiment.
A request passed the SLO when TTFT was no more than 1,000 ms and TPOT was no more than 100 ms. I also recorded queue depth, active requests, KV-cache use, and preemptions. All 4,608 requests completed with their requested output length, and vLLM reported no preemptions. A p95 latency reports the value that 95% of requests met or beat, while the slowest 5% took longer.
Four server configurations tested the baseline, a lower max_num_seqs, half
the GPU-memory reservation, and chunked prefill disabled.
Poisson traffic: first-token latency failed first
At 2 requests per second, TTFT p95 was 979 ms, so the server remained just inside the 1-second boundary. At 3 requests per second, TTFT p95 reached 1,160 ms while TPOT p95 was only 51.5 ms. Once a request began generating, its tokens still arrived quickly. The main problem was waiting in the queue before the first token.
This happened because new prompts began arriving before the server had finished enough existing work. Requests waiting for prompt processing saw higher TTFT, while requests that had already started could still be grouped by continuous batching and receive later tokens quickly.
| offered load | TTFT p95 | TPOT p95 | SLO attainment | interpretation |
|---|---|---|---|---|
| 1 request/s | 812 ms | 22.8 ms | 99.0% | comfortably within SLO |
| 2 requests/s | 979 ms | 33.6 ms | 92.7% | highest passing load |
| 3 requests/s | 1,160 ms | 51.5 ms | 89.6% | TTFT fails first |
| 6 requests/s | 2,142 ms | 179.1 ms | 33.3% | both limits fail |
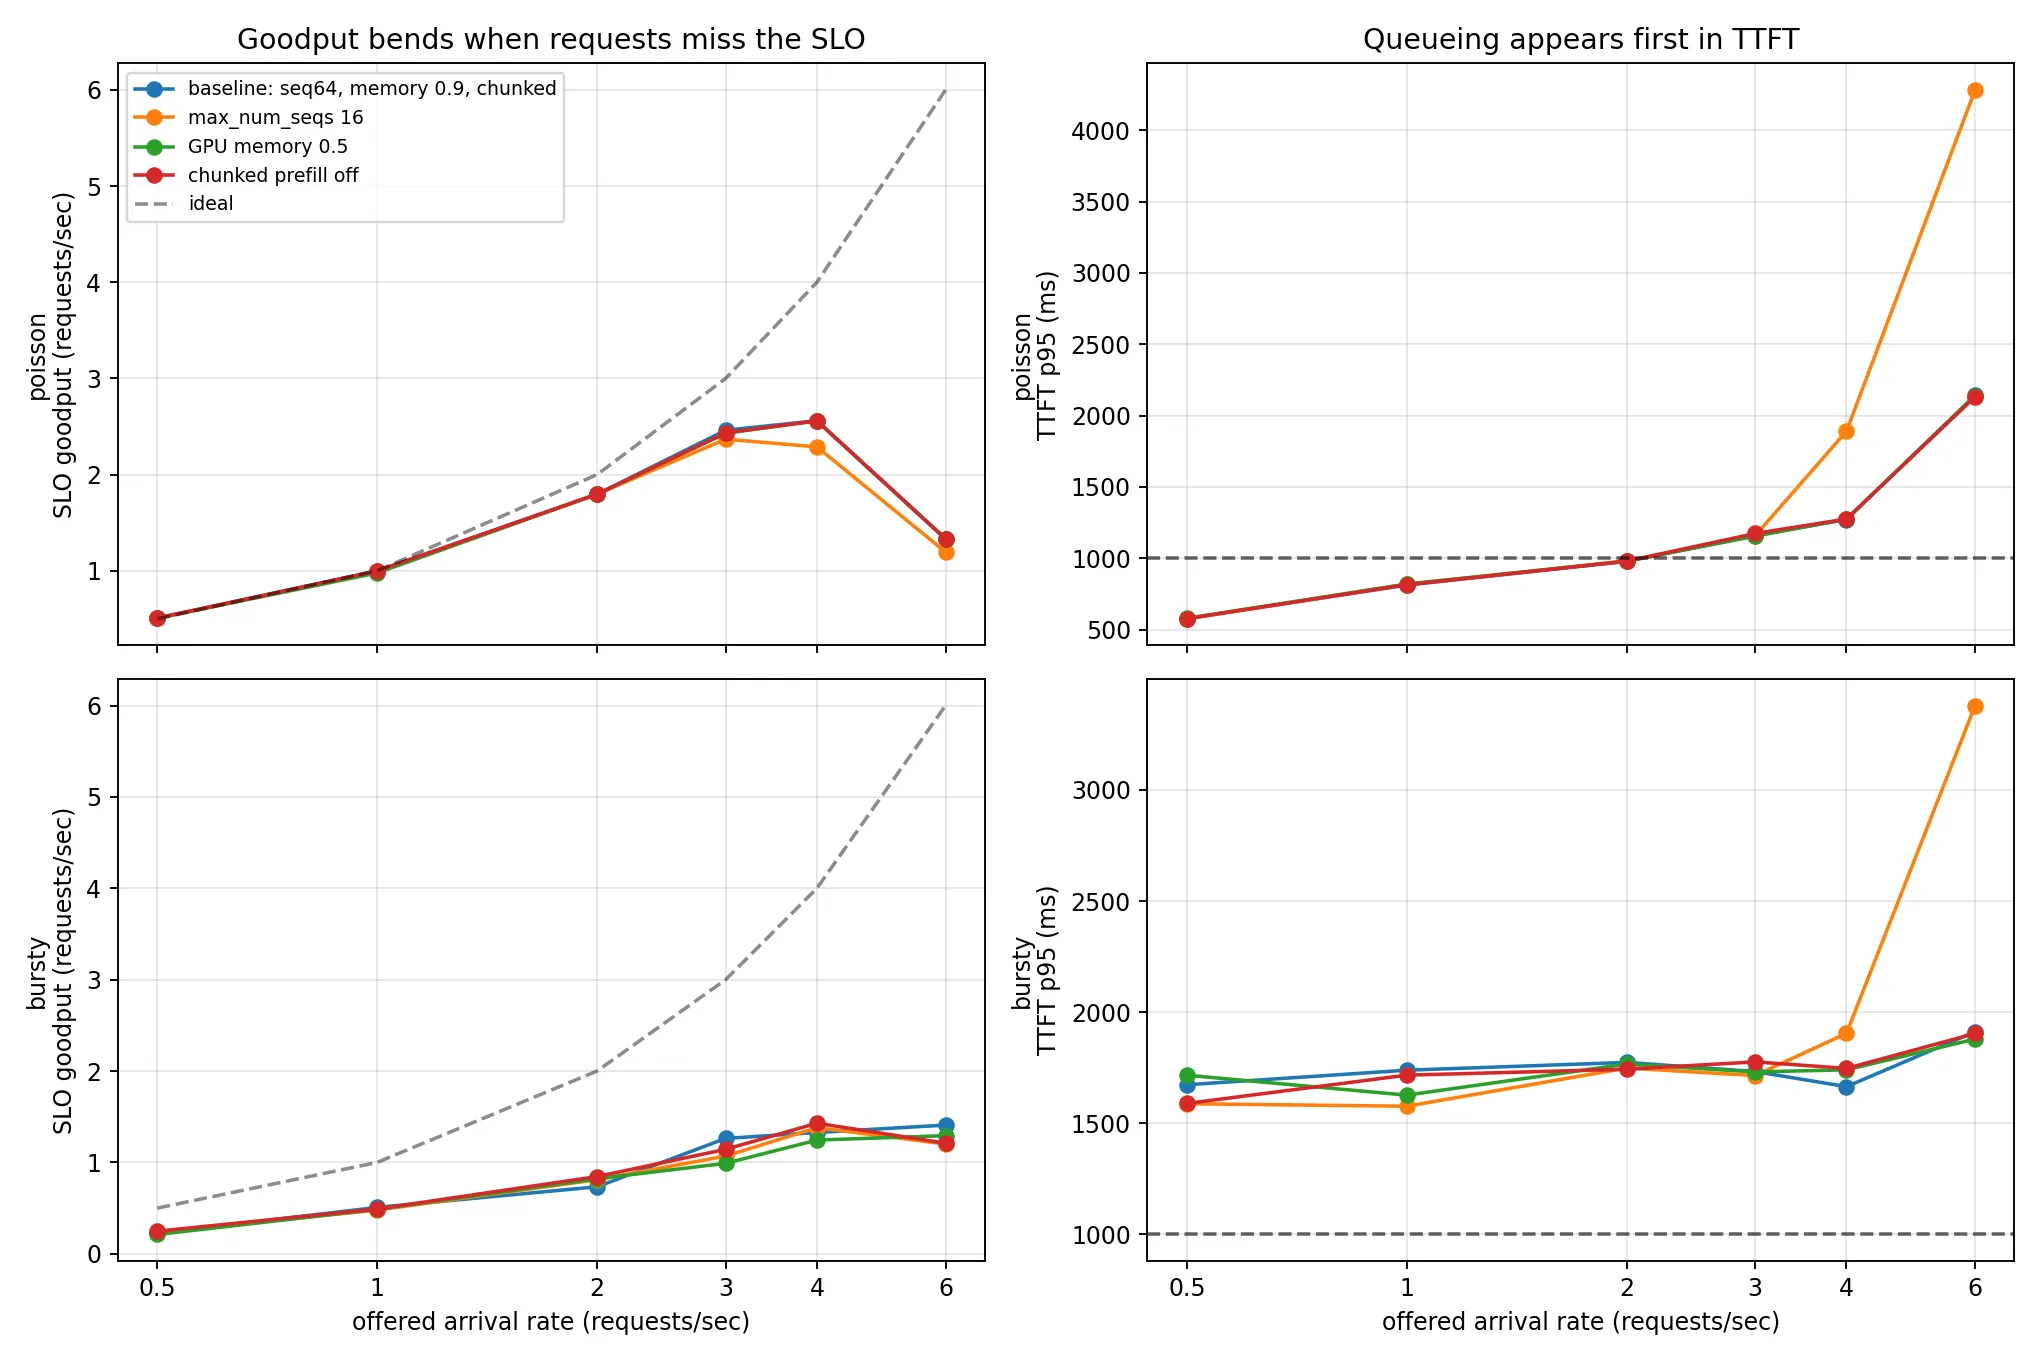
The useful-capacity boundary counts requests that meet both latency limits, not every token the server eventually produces.
Raw output throughput continued rising after the server crossed its useful capacity. From 4 to 6 offered requests per second, output throughput increased from 311 to 355 tokens per second, but SLO goodput fell by 48%. The server did more total work, but less of it arrived on time. At 6 requests per second, the GPU stayed busy and produced more tokens, but the larger queue delayed enough requests that fewer of them satisfied both latency requirements.
Fixed bursts: a low average rate still hid an overloaded moment
For eight-request bursts, reducing the mean rate only lengthened the quiet time between groups. It did not reduce the queue faced by the eight simultaneous requests.
| average offered load | TTFT p95 | TPOT p95 | SLO attainment |
|---|---|---|---|
| 0.5 requests/s | 1,674 ms | 34.2 ms | 45.8% |
| 2 requests/s | 1,774 ms | 30.3 ms | 40.6% |
| 6 requests/s | 1,913 ms | 133.9 ms | 36.5% |
TTFT remained similar at 0.5 and 2 requests per second because each group still began with the same eight simultaneous requests. The lower average rate only added more quiet time after that group. At 6 requests per second, groups arrived closer together, so work from one burst could still be present when later work arrived. This likely contributed to TPOT crossing its limit.
No tested burst rate reached 90% SLO attainment. We therefore cannot report a safe capacity for eight-request bursts from this sweep. The result is only that the safe average is below 0.5 requests per second, or that the server must admit fewer than eight simultaneous requests to meet this TTFT target.
Effect of scheduling settings on latency and capacity
All four configurations had the same Poisson SLO capacity of 2 requests per second. Halving the GPU-memory reservation and disabling chunked prefill were neutral for this model and workload. None of these settings increased the rate at which the tested request mix could finish within both latency limits. The measurements below show that one setting moved work into the queue, while the other two changed resources that were not limiting this experiment.
| configuration | SLO capacity | TTFT p95 at 6/s | TPOT p95 at 6/s | max queue |
|---|---|---|---|---|
| baseline | 2 requests/s | 2,142 ms | 179 ms | 6.5 |
max_num_seqs=16 | 2 requests/s | 4,283 ms | 71 ms | 15.5 |
| GPU memory reservation 0.5 | 2 requests/s | 2,139 ms | 177 ms | 6.5 |
| chunked prefill off | 2 requests/s | 2,132 ms | 177 ms | 6.5 |
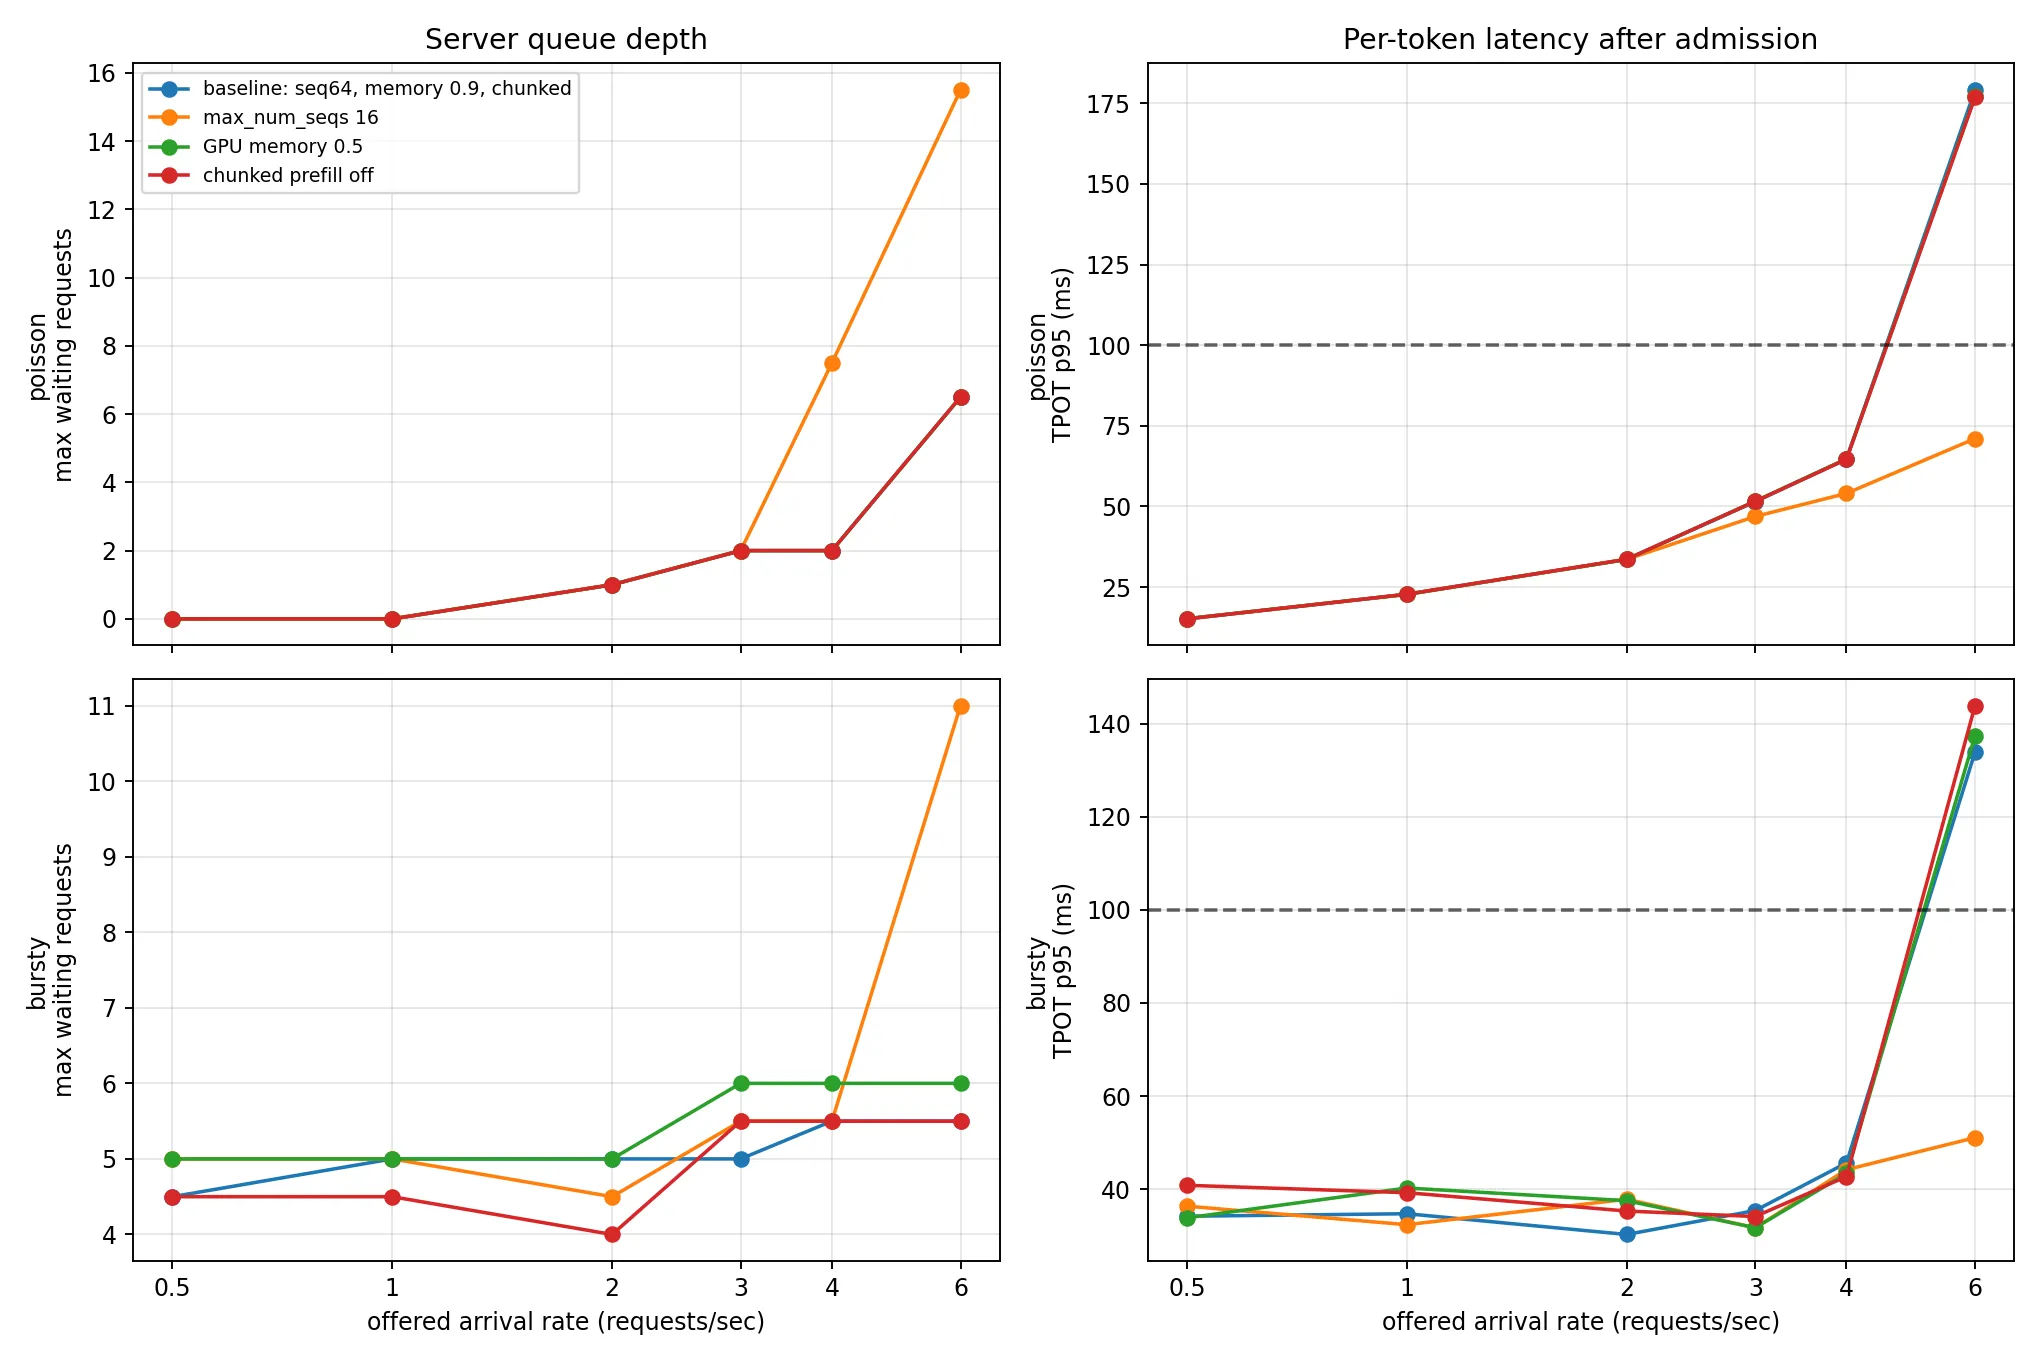
Limiting active sequences protected generation speed for admitted requests by moving more work into the waiting queue.
max_num_seqs limits how many sequences vLLM can process together. Reducing it
to 16 improved TPOT under heavy overload from 179 ms to 71 ms because fewer
active sequences shared each GPU step. However, the requests that could not run
moved into the queue. TTFT doubled from 2.14 to 4.28 seconds, and the maximum
queue increased from 6.5 to 15.5 requests. The setting improved token delivery
after generation began, but it did not increase the number of requests that met
both latency limits.
The GPU-memory reservation determines how much memory vLLM can use for the KV cache. The smaller reservation still had enough space for every request in this workload, so it behaved like the baseline and caused no preemptions.
Chunked prefill divides long prompt processing into smaller pieces so decode steps can run between them. Disabling it made no meaningful difference here. This does not mean the setting is always unimportant. A larger model, longer prompts, or a smaller token budget could make prefill interfere more strongly with active generation.
Conclusion
First-token latency was the first metric to cross its limit. At 3 requests per second, users waited too long for the response to begin even though later tokens still arrived within the TPOT limit. Total token throughput continued to rise because the GPU kept processing requests, including requests whose first token was already late. Tokens per second alone would therefore overestimate how much traffic the server could handle within the latency requirements.
Average request rate was also insufficient for bursty traffic. A long quiet period can make the average look safe without helping the requests that arrive together. Serving systems need to plan around latency targets, burst size, and queue behavior, not only tokens or requests per second.
The numerical capacity belongs to this GPU, model, request-length mix, and SLO. The experiment used two matched workload repeats and a fixed burst size of eight, so it does not establish a universal safe rate or the largest safe burst.
GitHub repository
The complete report, raw measurements, benchmark code, and reproduction instructions are available in the LLM Inference Optimization repository.